Online course creators face a dual threat: high student dropout rates and revenue lost to content piracy. The right video analytics platform helps with both. By tracking engagement metrics and forensic data, educators can improve course completion rates while identifying where content leaks occur. In this guide, we compare the top video analytics platforms and their current pricing—including secure, enterprise-grade solutions—so you can improve retention, protect your intellectual property, and build a more data-driven course optimization process.
Why Video Analytics Matter More Than Ever
The shift toward data-driven educational decision-making has accelerated significantly. With the global online education market experiencing rapid growth, video analytics have emerged as a critical differentiator between successful and struggling online courses.
The Engagement Crisis in Online Education
Without proper video analytics, course creators operate blindly, often discovering retention problems only after significant student dropout has occurred.
Protect your course with Inkrypt Videos
Research shows that systematic tracking of student engagement activities is essential for improving success outcomes.
Measurable Impact on Learning Outcomes
Video analytics effectiveness shows up across multiple dimensions:
- Educators broadly agree that student engagement is one of the most important metrics for measuring student success
- Institutions implementing engagement analytics have reported meaningful reductions in new-student withdrawal rates
- Success rates have also improved for students repeating courses under analytics-driven programs
- Research by Naeem and Bosman (2023) found a real correlation (r = 0.71) between engagement with LMS activities and student grades — more detail on this study is in the Resources section below
Market Growth Driving Innovation
The video analytics market’s growth reflects institutional investment in measurable outcomes. Valued at $12.39 billion in 2025 and projected to reach $33.74 billion by 2030 (22.18% CAGR), this sector attracts significant innovation in AI-powered engagement prediction.
Understanding Core Video Analytics Metrics That Drive Results
Modern video analytics platforms track multiple engagement indicators that provide actionable insights into student learning behaviors. These metrics form the foundation for data-driven course optimization and improved student outcomes.
Video Completion Rates and Watch Time Analysis
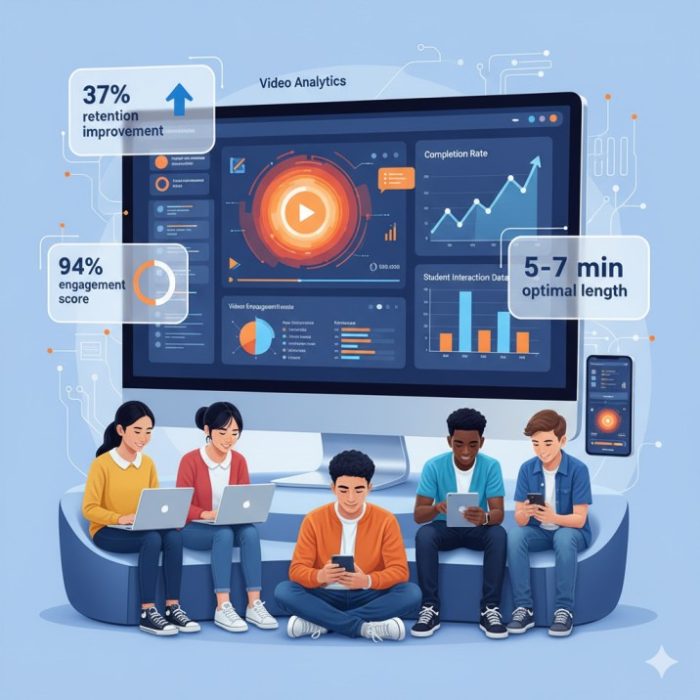
The most critical metric measures how long students watch videos versus total content length. Research consistently shows that shorter videos are significantly more engaging, with optimal engagement occurring in 5-7 minute segments. Studies reveal students tend to drop out early in longer videos, often watching only a fraction of extended lecture recordings.
Engagement Heatmaps and Drop-off Point Analysis
Advanced video analytics platforms provide visual representations of when students pause, rewind, or skip content sections. This data reveals that students generating higher volumes of video interactions tend to show meaningfully better retention in online courses compared to passive viewers.
Interactive Element Performance Tracking
Modern platforms track student engagement with embedded quizzes, polls, clickable elements, and calls-to-action. These interactions serve as strong predictors of course completion rates and comprehension levels, enabling instructors to optimize interactive content placement.
Mobile vs Desktop Video Consumption Patterns
A majority of learners now prefer mobile devices for accessing educational content, including specifically for video learning. This mobile-first trend requires analytics platforms to provide device-specific engagement insights and responsive optimization recommendations.
Student Engagement Patterns: What the Research Reveals
Recent large-scale studies provide unprecedented insights into how students interact with educational videos. An analysis of a large-scale dataset comprising over one million rows of video interaction logs revealed valuable insights into students’ video engagement behaviors.
Optimal Video Length Findings
Research consistently demonstrates that well-conceptualized videos increase viewing time, with a meaningful share of students engaging with videos for well over 30 minutes when the content covers focused topics. While shorter videos generally have higher completion rates, many remain untouched.
Behavioral Clustering Analysis
From 11 log behaviors represented by log data from 72 college students, four behavioral patterns were identified while students learned from videos: browsing, social interaction, information seeking, and environment configuration. Understanding these patterns enables personalized content delivery.
Engagement Goals and Intent Mapping
Students’ video viewing activities contribute to their engagement goals and intentions. Researchers identified a variety of engagement goals, specifically Reflect, Flag, Remember, Clarify, Skim, Search, Orient, and Take a break. This granular understanding allows for targeted content optimization.
Performance Correlation
Research by Naeem and Bosman (2023) found a strong positive correlation (r = 0.71) between engagement with LMS activities and student grades, establishing video engagement as a reliable predictor of academic success.
Top Video Analytics Platforms Comparison: Pricing & Features
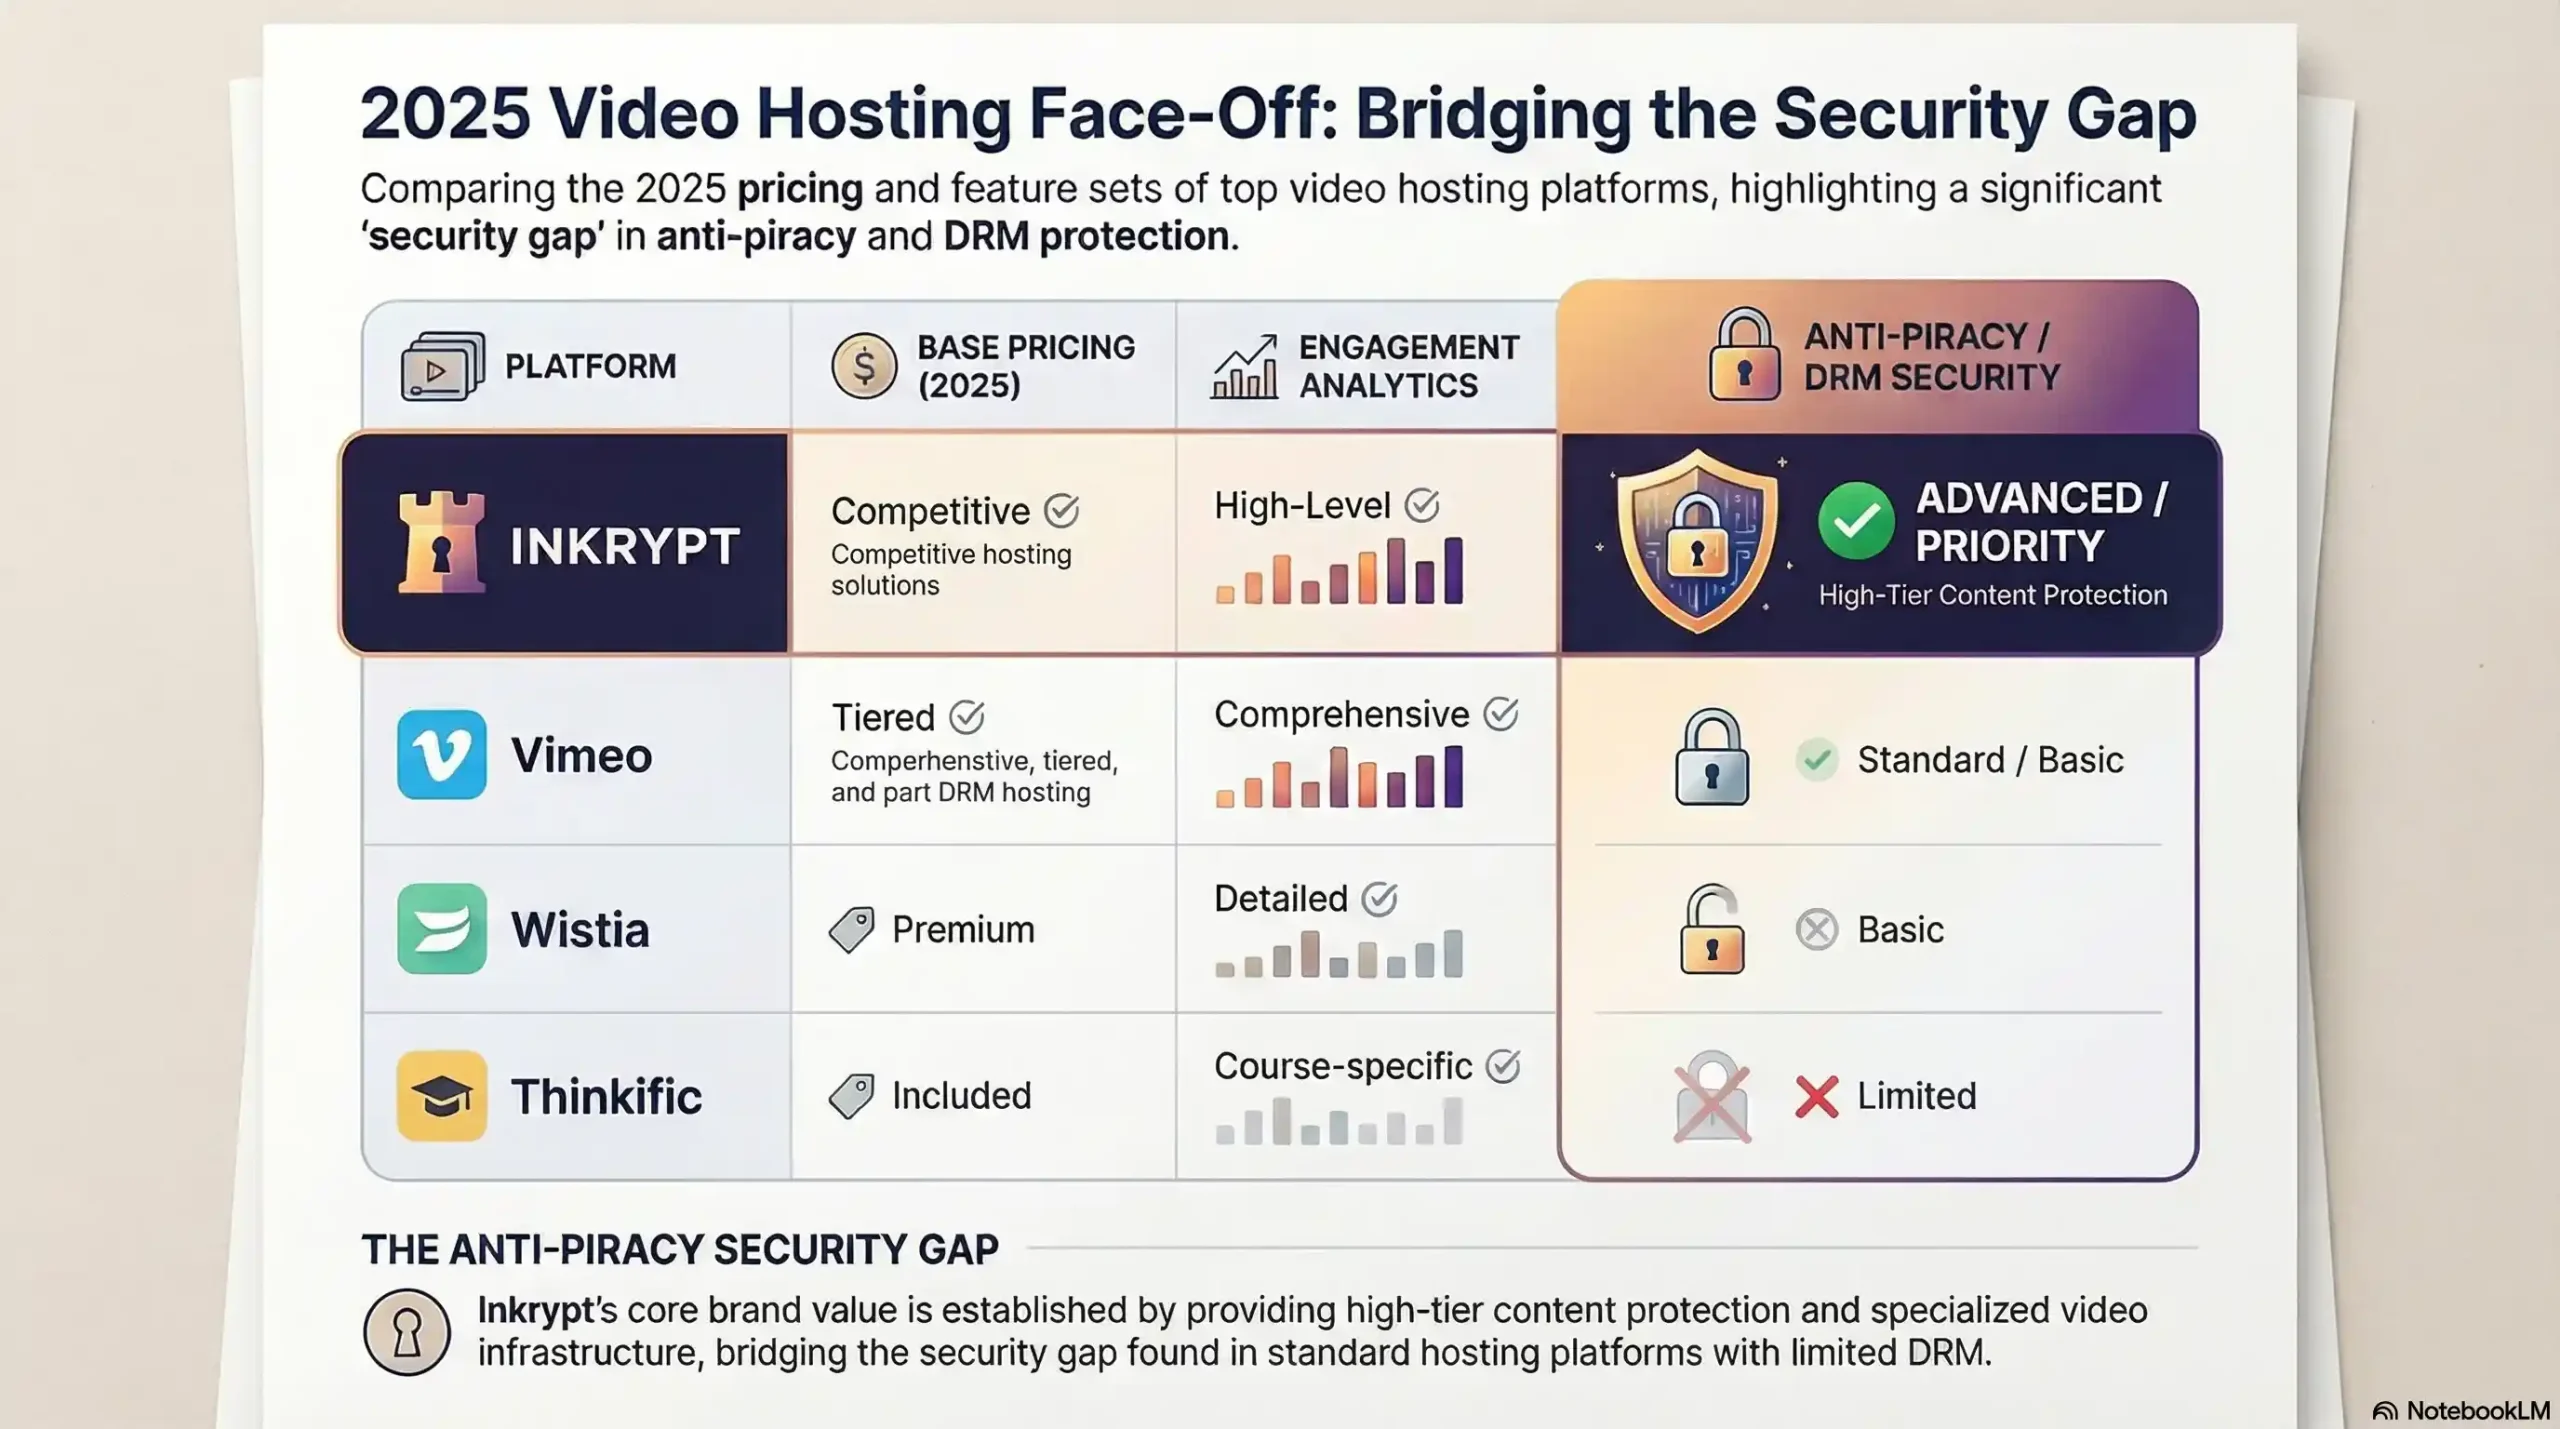
The video analytics landscape offers solutions ranging from basic tracking to sophisticated AI-powered insights. Here’s a comparison of leading platforms with feature analysis and pricing verified as of this writing.
Vimeo Business Analytics: Best for Content Creators
Pricing Structure (approximate — verify before quoting):
- Free Plan: Limited storage, basic analytics
- Starter Plan: Roughly $12-20/month – Expanded storage, advanced analytics, custom players
- Standard Plan: Roughly $20-41/month – Brand kit, marketing integrations, detailed metrics
- Advanced Plan: Roughly $65-75/month – Live streaming, webinars, comprehensive reporting
Vimeo has restructured its pricing more than once this year — confirm exact current numbers on Vimeo’s own pricing page before using these in a client-facing comparison.
Key Strengths: High-quality video delivery, privacy controls, geographic tracking, and device analytics. Vimeo excels in providing professional-grade analytics with comprehensive privacy features ideal for sensitive educational content.
Wistia Marketing Analytics: Best for Business-Focused Courses
Pricing Structure (verified current):
- Free Plan: $0/month – 25GB storage, 1 user, basic analytics
- Business Plan: $79/month – 250GB+ storage, 3+ users, removes branding, heatmaps, advanced analytics
- Business + Lead Gen Plan: $329/month – Adds marketing automation integrations (HubSpot, Marketo, and others) for lead capture and scoring
- Enterprise: Custom pricing, with SSO and dedicated support
Wistia’s older Plus/Pro/Advanced plan names and per-video billing have been retired — if you’ve seen pricing referencing those names elsewhere, it’s out of date.
Key Strengths: Advanced lead generation tools, detailed heatmap analysis, marketing automation integration, and comprehensive A/B testing capabilities. Wistia provides sophisticated business intelligence for course monetization.
Thinkific Integrated Analytics: Best for All-in-One Course Creation
Pricing Structure (verified current):
- Basic Plan: $49/month ($36/month billed annually) – Course creation with core analytics
- Start Plan: $99/month ($74/month billed annually) – Enhanced analytics, custom domains, memberships
- Grow Plan: $199/month ($149/month billed annually) – Advanced reporting and integrations
- Plus: Custom enterprise pricing
Note: Thinkific’s free tier is limited in scope (typically capped at a single course) rather than offering full-featured access for unlimited students — confirm current details before including in client-facing comparisons.
Key Strengths: Seamless course creation integration, student progress tracking, engagement dashboards, and quiz performance analytics. Thinkific offers a comprehensive all-in-one solution for course creators.
Platform Selection Decision Framework
For Individual Course Creators: Start with Thinkific’s integrated solution or Vimeo’s entry-level plan for cost-effective analytics with professional features.
For Marketing-Focused Businesses: Invest in Wistia’s lead generation and conversion tracking capabilities despite the higher cost.
For Educational Institutions: Consider Vimeo’s privacy features and Thinkific’s tiered pricing for large student populations.
Essential Evaluation Criteria:
- Integration capabilities with existing Learning Management Systems
- Real-time reporting vs. batch processing requirements
- Privacy compliance features for educational data protection
- Scalability for anticipated student population growth
- Total cost of ownership, including setup and training time
Implementation Strategies for Course Creators
Successful video analytics implementation requires systematic planning and ongoing optimization. The following strategies maximize the value of engagement data.
Setting Up Comprehensive Tracking
Begin with baseline measurements before implementing changes. Track multiple metrics simultaneously to understand relationships between different engagement indicators. Research in this space has engineered dozens of activity-based features to classify student engagement into high, moderate, and low levels.
Interpreting Data for Course Improvement
Focus on actionable insights rather than vanity metrics. Teachers can access real-time student performance data to understand strengths, weaknesses, and engagement patterns. Look for patterns in drop-off points, replay behavior, and completion rates to identify content areas requiring improvement.
A/B Testing Video Content
Systematically test different video lengths, presentation styles, and interactive elements. Informal talking-head videos tend to outperform static slide narration, which in turn tends to outperform traditional lecture formats.
Creating Feedback Loops
Establish processes for translating analytics insights into content improvements. Predictive modeling tools can project student outcomes at future points in a program, allowing educators to intervene earlier where necessary.
Advanced Analytics: AI and Predictive Insights
Artificial intelligence is transforming video analytics from reactive reporting to proactive optimization. AI-powered video analytics can enhance the learning experience through smart, automated quiz generation that adjusts to a student’s understanding of the course material.
Machine Learning for Engagement Prediction
Research in this area has found that Support Vector Machine (SVM) algorithms can achieve strong classification accuracy in predicting student engagement levels. These predictive models enable early intervention for at-risk students.
Automated Content Optimization
Real-time engagement tracking features monitor participation, attention levels, and learning patterns, allowing instructors to provide timely interventions when needed. AI systems can automatically adjust content difficulty based on engagement patterns.
Personalized Learning Recommendations
Advanced analytics platforms use viewing behavior to suggest personalized learning paths. Smart content recommendations adjust to individual learning patterns and preferences.
Early Warning Systems
Predictive analytics can help forecast student success or identify those at risk, enabling timely interventions. These systems flag students requiring additional support before performance decline becomes critical.
ROI and Business Impact Measurement
Video analytics investments must demonstrate measurable returns through improved learning outcomes and operational efficiency.
Training Effectiveness
Large-scale online learning platforms increasingly rely on AI-powered video analytics to identify engagement patterns and improve completion rates at scale — a sign of how mainstream this technology has become beyond individual course creators.
Revenue Impact Assessment
Many organizations report positive ROI from video analytics investment through improved retention rates and operational efficiencies, though the exact return varies significantly by course price point, audience size, and how the data gets acted on.
Cost-Benefit Analysis Framework
Consider both direct costs (platform subscriptions, implementation time) and indirect benefits (reduced support requests, improved student satisfaction, higher course completion rates) when evaluating whether an analytics investment is paying off.
Future Trends and Emerging Technologies
The video analytics landscape continues evolving with emerging technologies that promise even deeper insights into learning behaviors.
AR/VR Analytics Integration
As immersive learning experiences become mainstream, analytics platforms are developing capabilities to track engagement within virtual environments. These tools measure spatial attention, interaction quality, and presence indicators.
Voice Interaction Tracking
Voice-enabled learning is growing rapidly, requiring analytics that measure speech patterns, question complexity, and verbal engagement quality. These metrics provide insights into communication skills development.
Biometric Engagement Monitoring
Advanced systems integrate physiological data (heart rate, eye tracking, facial expressions) to measure authentic engagement beyond simple viewing behavior. This technology offers unprecedented insight into learning effectiveness.
Emerging regulations require analytics platforms to provide meaningful insights while protecting student privacy. Techniques like federated learning and differential privacy are becoming standard features.
Resources and Citations
The following peer-reviewed studies and authoritative market reports provided the foundational data and insights for this analysis:
- “Decoding Video Logs: Unveiling Student Engagement Patterns in Lecture Capture Videos“ The International Review of Research in Open and Distributed Learning (2024)
- “Video Analytics in Digital Learning Environments: Exploring Student Behaviour Across Different Learning Contexts“ Technology, Knowledge, and Learning (2023)
- “Video Analytics Market Size & Forecast 2025-2030“ Mordor Intelligence Industry Reports (2025)
Conclusion: The Future of Online Education is Data-Driven
The evidence presented throughout this analysis demonstrates that video analytics have evolved from nice-to-have tools to essential infrastructure for successful online education. With the global video analytics market expanding at a 22.18% CAGR and reaching $12.39 billion in 2025, the technology has matured to deliver measurable results for course creators and educational institutions.
The research is consistent on the direction, even if exact figures vary by study and institution: platforms implementing video analytics tend to see meaningfully lower dropout rates and improved student engagement, and — per the Naeem and Bosman (2023) research cited above — there’s a real, measured correlation between LMS engagement and student success (r = 0.71). These aren’t marginal improvements—they represent genuine shifts in educational outcomes that directly impact student lives and institutional sustainability.
The Competitive Imperative
As we’ve seen through platform comparisons and market analysis, the barriers to video analytics adoption continue to decrease while the benefits compound. Entry-level options from Thinkific and Vimeo make sophisticated tracking accessible to individual course creators, while more advanced solutions from Wistia provide deeper capabilities for scaling organizations.
The question is no longer whether to implement video analytics, but how quickly you can begin leveraging these insights to optimize learning experiences. Early adopters consistently outperform competitors who rely on intuition over data, creating sustainable advantages in student satisfaction, retention, and word-of-mouth referrals.
Your Implementation Roadmap
Success with video analytics requires a systematic approach rather than ad-hoc experimentation. Begin with baseline measurements using free or entry-level platform options, focus on proven engagement drivers like 5-7 minute video segments, and gradually implement advanced features like heatmap analysis and predictive interventions.
The platforms, strategies, and insights outlined in this guide provide a starting roadmap for creating more effective, engaging, and successful online learning experiences. Student expectations for personalized, optimized learning experiences will only increase as analytics capabilities become standard across the industry.
Ready to improve your online course performance with video analytics? Start by evaluating your current engagement metrics and selecting the platform that best matches your specific needs and budget.