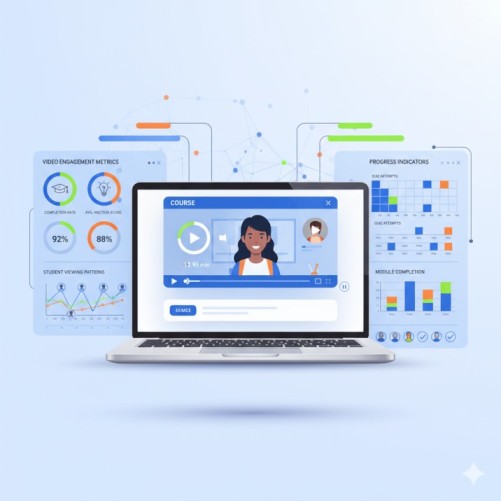
Struggling with low online course completion rates? Video analytics for online courses tracks granular student interactions—like play, pause, and rewind patterns—allowing educators to identify meaningful engagement patterns tied to student outcomes. By shifting from traditional metrics to analytics-informed design, course creators can identify at-risk students early, personalize learning paths, and meaningfully improve completion rates.
Explore Inkrypt’s Video Analytics
Understanding Student Engagement Patterns Through Video Data
Video analytics reveal distinct behavioral patterns that correlate with student success. Understanding these patterns enables targeted interventions and content optimization strategies.
Active Learning Patterns
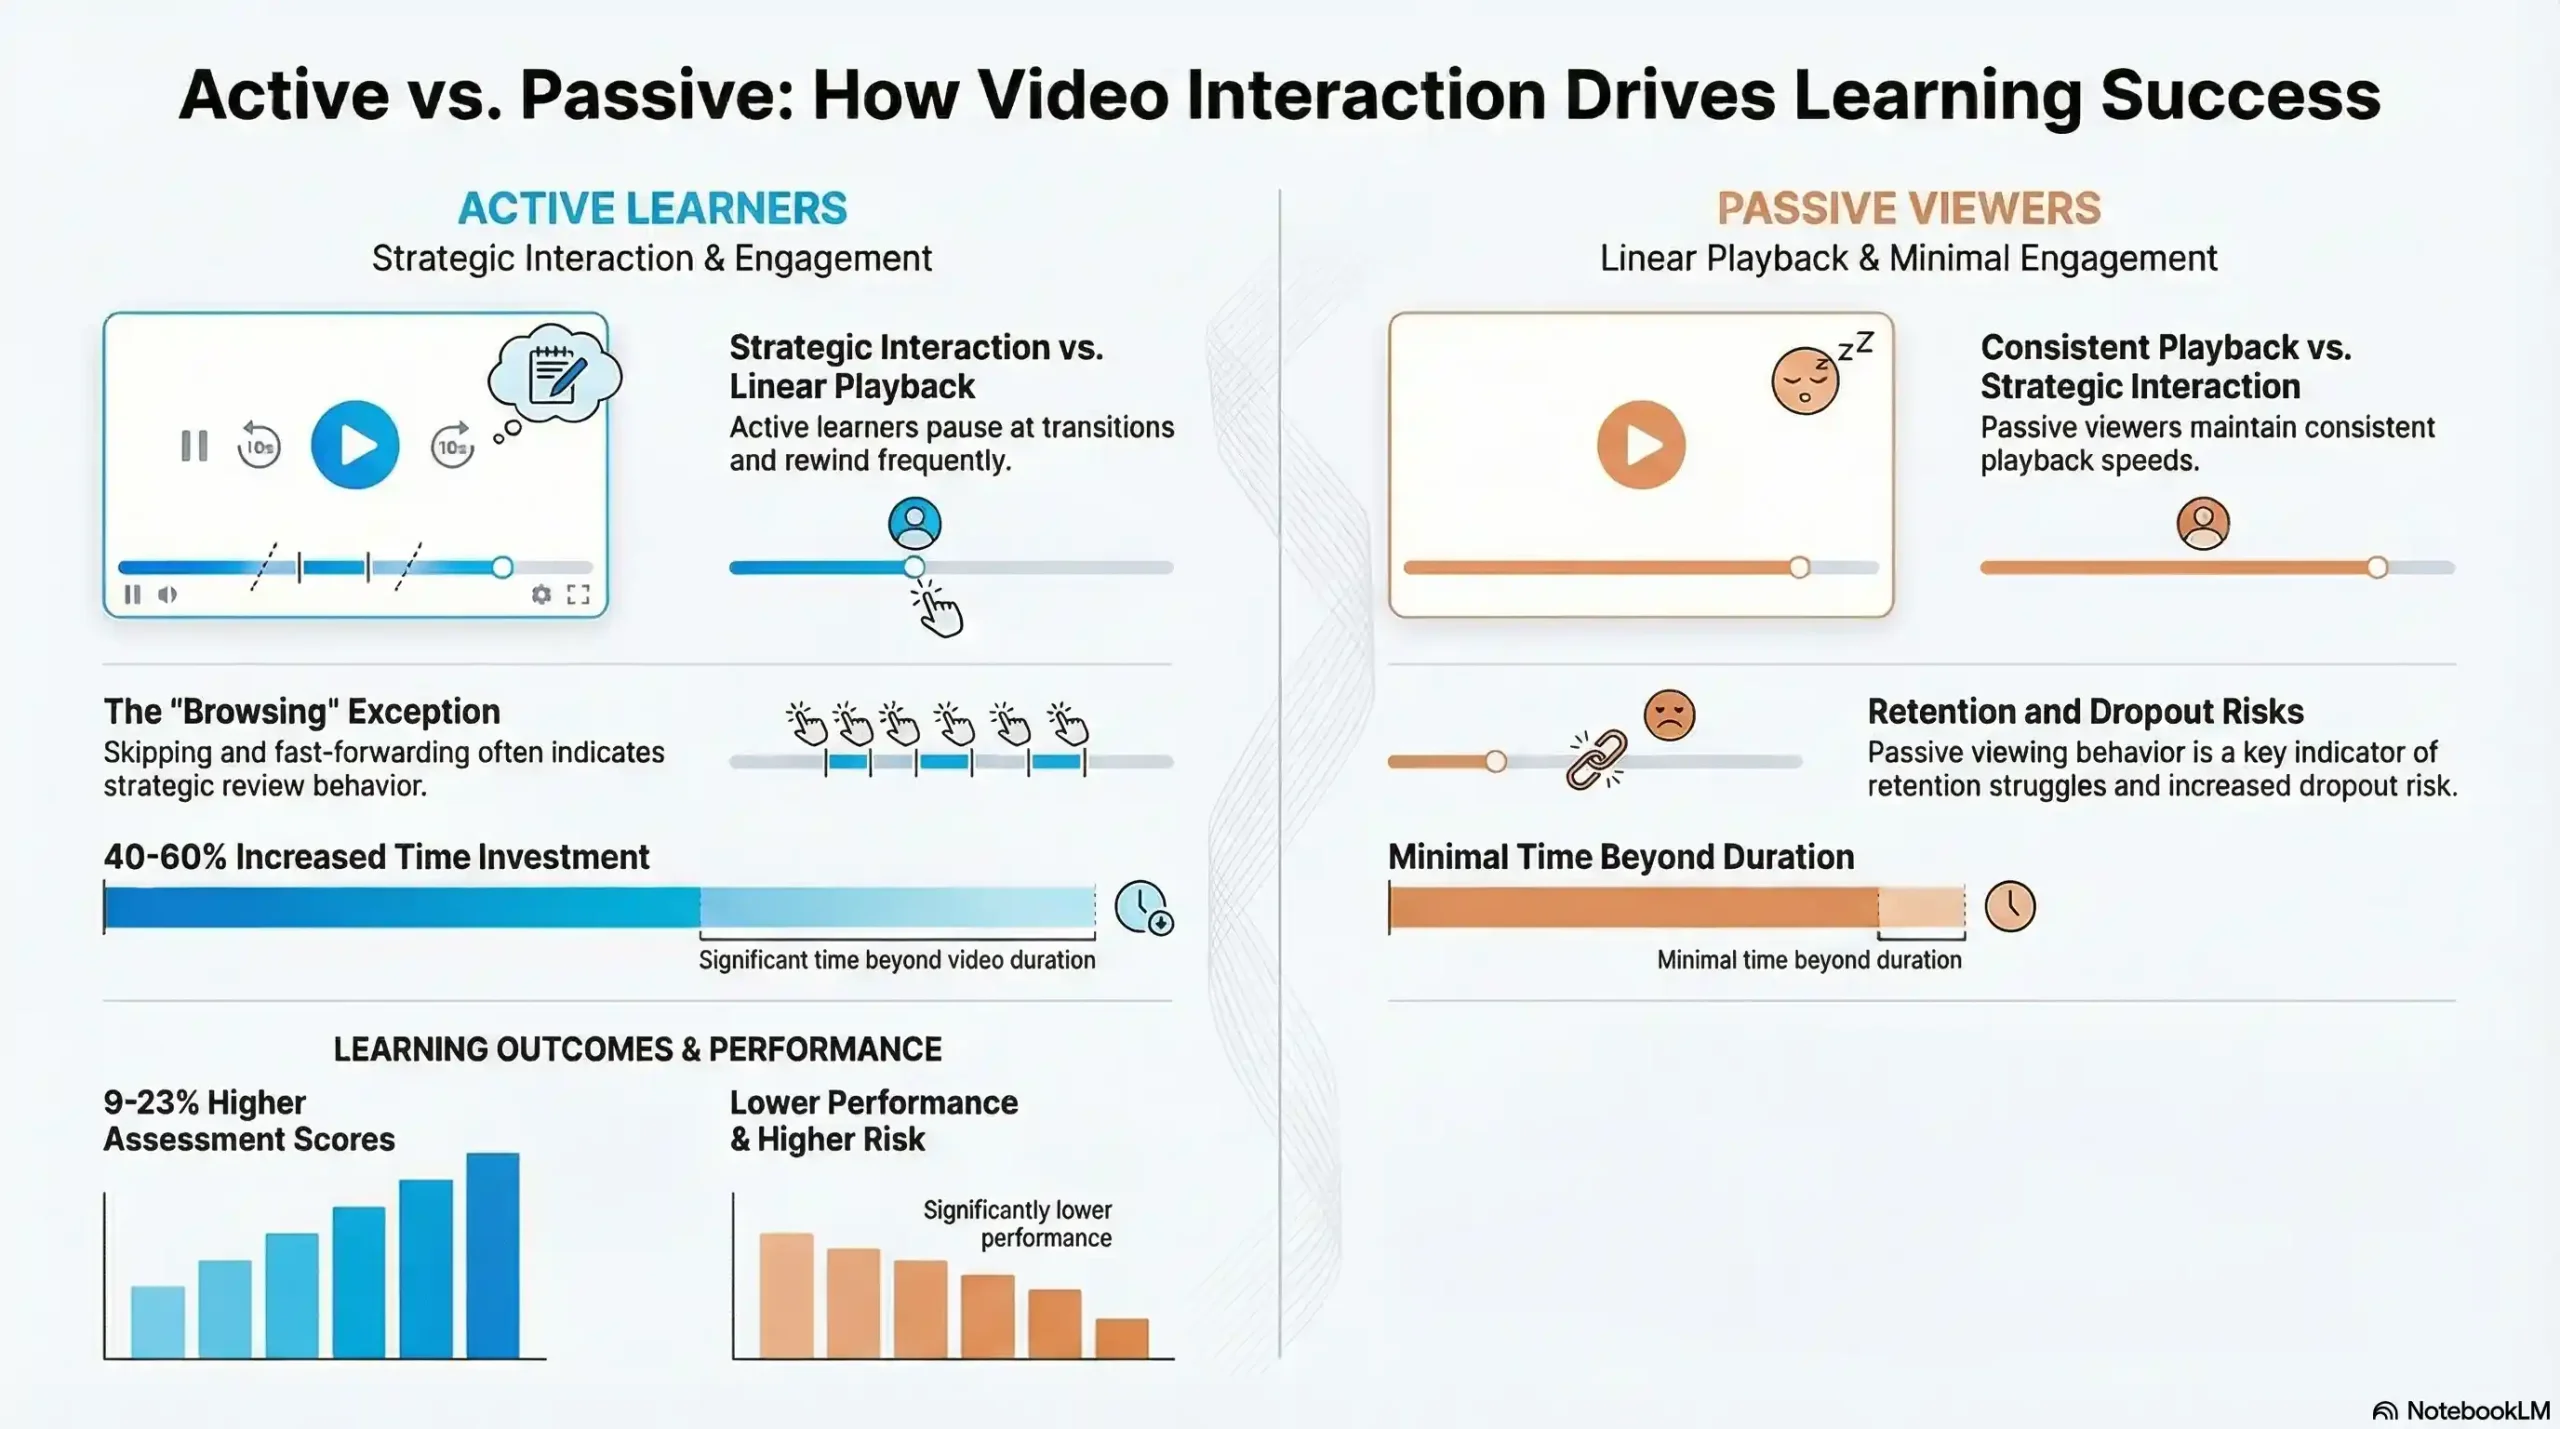
Active learners demonstrate high interaction levels through frequent pausing, rewinding, and note-taking behaviors. These students spend meaningfully more time engaging with content than the raw video duration would suggest, with strategic pauses at concept transitions and systematic progression through materials. Active learners tend to score higher on assessments and show increased participation in supplementary activities.
Passive and Browsing Behaviors
Passive viewers play videos with minimal interaction, showing consistent playback speeds and low revisit rates. While appearing engaged, these students often struggle with retention and have higher dropout risks. Browsing patterns involve strategic skipping and fast-forwarding, typically indicating review behavior rather than disengagement.
Early Warning Indicators
Critical dropout predictors include declining engagement in weeks 2-3, abandoning videos before 50% completion, and irregular viewing schedules. Students exhibiting these patterns benefit from timely intervention — the sooner a course creator or instructor follows up, the more likely the intervention lands before disengagement solidifies. Analytics can meaningfully improve early identification of at-risk students, especially when combined with early assignment performance data.
Essential Video Analytics Metrics for Course Creators
Effective online course analytics implementation requires tracking specific metrics that provide actionable insights into student engagement and learning effectiveness.
Core Engagement Metrics
Completion Rates: Industry benchmarks generally run lower for free courses than paid ones, with analytics-informed courses tending to reach meaningfully higher completion rates than either baseline. Videos between 3-6 minutes achieve optimal engagement, with significant attention drops beyond 12 minutes — consistent with published research showing median engagement time peaks around 6 minutes regardless of total video length.
Interaction Frequency: Students who actively use video controls (pause, rewind, speed adjustment) tend to demonstrate meaningfully higher learning retention and better assessment performance than passive viewers.
Retention Curves: Identify specific drop-off points within videos to optimize content structure and pacing. Educational content typically sees attention decline after 6 minutes.
Performance Correlation Indicators
Video engagement metrics correlate with assessment performance and course completion rates. Students with high video engagement tend to show meaningfully better learning outcomes. Analytics also track how video content drives discussion participation and collaborative learning behaviors.
Platform-Specific Video Analytics Capabilities
Different platforms offer varying analytics sophistication levels, requiring strategic selection based on specific needs and capabilities.
Learning Management System Analytics
Canvas Analytics: Integrated video tracking with course completion correlation and real-time dashboards. Best for institutions seeking seamless LMS integration.
Moodle Analytics: Open-source flexibility with plugin options for enhanced tracking. Cost-effective for budget-conscious institutions.
Blackboard Analytics: Comprehensive reporting suite with cross-platform data aggregation. Ideal for large institutions requiring enterprise-grade features.
Specialized Video Analytics Platforms
Vimeo Analytics (roughly $12-75/month, verify current pricing): Advanced engagement heatmaps and detailed viewer behavior analysis. Perfect for professional course creators seeking granular insights. Vimeo has adjusted its pricing structure more than once recently, so confirm exact current tiers before quoting.
Wistia (Free–$329+/month): A/B testing capabilities with lead generation integration on higher tiers. Excellent for marketing-focused courses requiring conversion optimization.
Thinkific Analytics: All-in-one platform with integrated course and video metrics, plus revenue correlation tracking. Ideal for course creators and coaches.
Implementation Strategies for Maximum ROI
Successful video analytics implementation follows a structured approach that maximizes return on investment while improving student outcomes.
Week 1: Assessment and Planning
- Audit existing video content and platform capabilities
- Define primary objectives (completion, engagement, retention)
- Set baseline metrics and establish intervention protocols
- Calculate ROI projections and secure budget approvals
Week 2: Technical Setup
- Install the chosen analytics platform and configure tracking
- Create dashboards for key metrics monitoring
- Set up automated reporting and alert systems
- Develop training materials for the team onboarding
Week 3: Launch and Optimization
- Begin tracking on pilot content and monitor accuracy
- Conduct team training on analytics interpretation
- Implement initial optimizations based on data insights
- Establish intervention procedures for at-risk students
Week 4: Full Deployment
- Expand tracking to all video content
- Launch automated intervention systems
- Configure advanced features like A/B testing
- Establish continuous improvement processes
ROI Measurement Framework
Investment Categories: Platform costs, implementation time, training costs — these vary significantly based on course scale and chosen platform, so build your own baseline rather than assuming industry averages apply.
Return Categories: Improved completion rates, reduced support costs from fewer confused or stuck students, higher student satisfaction, and increased revenue from better retention and stronger word-of-mouth. The specific magnitude of each will depend heavily on your course price point, audience size, and how consistently the data gets acted on.
Resources and Citations
The research and data in this article are supported by peer-reviewed studies and industry reports from leading educational technology sources.
- “The impact of short videos on student performance in an online-flipped college engineering course“ Nature – Humanities and Social Sciences Communications (2022)
This study analyzed students across multiple academic terms and found that short videos improved student engagement by 24.7% in viewing time and increased final exam scores by 9.0% compared to longer video formats. The research provides quantitative evidence supporting optimal video length strategies for online education. - “Video learning analytics: Investigating behavioral patterns and learner clusters in video-based online learning“ The Internet and Higher Education (2021)
Research examining data from 72 college students identified four distinct behavioral patterns in video-based learning: browsing, social interaction, information seeking, and environment configuration. The study demonstrated that active learners showed higher achievement than passive learners, with engagement analytics enabling predictive modeling for student success. - “How video production affects student engagement: An empirical study of MOOC videos“
This large-scale study analyzing 6.9 million video-watching sessions found that median engagement time peaks at around 6 minutes, regardless of total video length, with shorter videos showing the highest completion rates. The research forms the foundation for modern video length optimization strategies in online education.
Conclusion
Video analytics has become an important driver of success in modern online learning. By tracking how students interact with video content—where they pause, rewatch, skip, or disengage—educators gain insights that traditional metrics simply can’t provide. These data patterns reveal learning challenges early, guide targeted interventions, and help redesign content for maximum comprehension. With platforms now offering increasingly sophisticated prediction capabilities and analytics-informed courses consistently outperforming industry completion-rate benchmarks, the value is clear. When course creators embrace data-driven decision-making, they unlock higher engagement, stronger performance, and a more personalized learning experience.
Ready to elevate your online course outcomes? Start implementing video analytics today. Choose a platform that fits your needs, track the metrics that matter, and use real engagement data to refine your content. Whether you’re aiming to boost completion rates, improve learning effectiveness, or identify at-risk students early, analytics is your path to smarter, more impactful online teaching.